
Sailing With Newton
a small sailboat journal
10 February 2008
13 June 2007
02 June 2007
11 October 2006
11 October 2006
22 July 2006
12 June 2006
12 June 2006 | Update from the RB&I Race
02 June 2006
01 May 2006
31 January 2006
19 September 2005
06 September 2005
11 July 2005
30 June 2005
06 June 2005
30 May 2005
22 May 2005
20 May 2005
17 May 2005
A post with a new image
10 February 2008
Duis autem vel eum iriure dolor in hendrerit in vulputate velit esse molestie consequat, vel illum dolore eu feugiat nulla facilisis at vero eros et accumsan et iusto odio qui blandit praesent luptatum zzril delenit augue duis dolore te feugait nulla facilisi. Lorem ipsum dolor sit amet, consectetuer adipiscing elit, sed diam nonummy nibh euismod tincidunt ut laoreet dolore magna aliquam erat volutpat.
Ut wisi enim ad minim veniam, quis nostrud exerci tation ullamcorper suscipit nisl ut aliquip ex ea commodo consequat. Duis autem vel eum iriure dolor in hendrerit in vulputate velit esse molestie consequat, vel dolore eu feugiat nulla facilisis at vero eros et accumsan iusto odio dignissim qui blandit praesent luptatum zzril delenit augue duis dolore te feugait nulla facilisi.
Ut wisi enim ad minim veniam, quis nostrud exerci tation ullamcorper suscipit nisl ut aliquip ex ea commodo consequat. Duis autem vel eum iriure dolor in hendrerit in vulputate velit esse molestie consequat, vel dolore eu feugiat nulla facilisis at vero eros et accumsan iusto odio dignissim qui blandit praesent luptatum zzril delenit augue duis dolore te feugait nulla facilisi.
MP3 File
13 June 2007
attaching an mp3 file... Our friend Todd wrote and recorded this to be used for a never-produced webexpeditions flash promo. Someday I'm going to get off my ass and use it...
gallery image test
02 June 2007
testing

SailBlogs Supports YouTube and Google Video
11 October 2006
This is a cool video from YouTube, illustrating in-blog videos from YouTube:
Google Video Support
11 October 2006
An in-blog video from Google Video showing ABN AMRO Volvo 70:
Transatlantic Sailing Records
22 July 2006
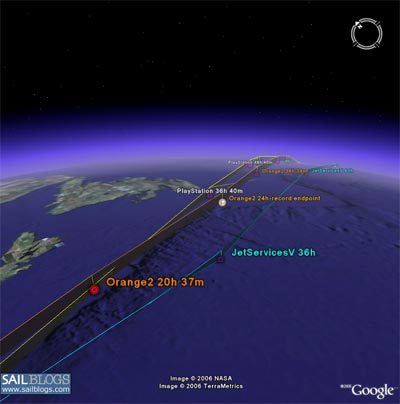
After Orange2's run earlier this month, I did some digging and scrounged data on Playstation and Jet Services V, and constructed this Google Earth comparison of the 3 runs. PlayStation had a limited dataset, so I pulled corresponding points, by elapsed time, from the Orange2 position tables. That way, the map sets up with coordinated elapsed time points, so you can see where all boats were at +36 Hours, for example. The points are color coded to match on each line.
To try and avoid so much colored spaghetti, I also made it so you can also limit the points to 4 times, to compare where that boats were at 36h, 65h, 80h, and the finish times (the odd spacing of the times is because of PlayStation's data).
For kicks, I also marked Orange's 24h record run. The speed fence is prev 24h average on Orange, overall average on PS and JSV.
Here is the link to the GE file: http://www.sailblogs.com/ge/transat.php
GE, Pt 2
12 June 2006
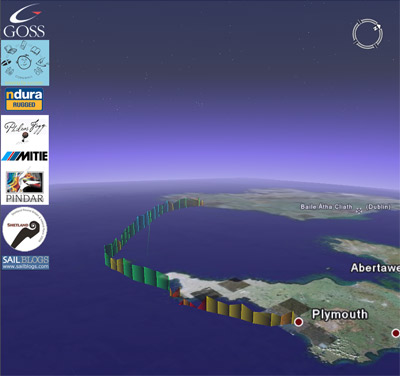
I came up with a good way to visualize boat speed data in Google Earth for Pete today. I was looking through the speed data from the first leg of the RBI, and noted that at one point Pete hit 18 knots. I thought that there must be some cool way to convey that info visually to people following the track.
I recalled something a saw where a pilot loaded is flight waypoints into GE, and used the altitude data to make a "3D fence" of his flight. I thought that something similar might work for sailboat racing, if I extended the numbers out enough.
So I multiplied Pete's speed by 1000, called that "altitude" and extruded the track line, switching colors to indicate speeds as well. The result is on the screen shot above. Pretty obvious where he lost wind for a bit...
| Vessel Name: | Newton |
| Vessel Make/Model: | newport 16 |
| Hailing Port: | minneapolis, mn |
| Crew: | tim harincar |
| Extra: | sailing the lakes around minneapolis, as well as near alexandria. |
Gallery not available
My Profile
Who: tim harincar
Port: minneapolis, mn