Kaimusailing
s/v Kaimu Wharram Catamaran
| Vessel Name: | Kaimu |
| Vessel Make/Model: | Wharram Custom |
| Hailing Port: | Norwalk, CT |
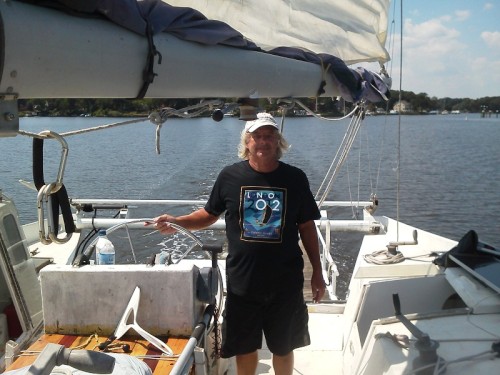
| Crew: | Andy and the Kaimu Crew |
| About: | Sailors in the Baltimore, Annapolis, DC area. |
17 April 2024 | St Marys, GA
Dinghy Skeg
I was suffering with what seemed like a cold and also had allergy symptoms. I awoke and felt fine. The green pollen that was coating everything was gone. Maybe it will return.
07 April 2024 | St. Marys, GA
Clammy Hands
Items came in from TEMU, the Chinese cut rate retailer. One was a nice little drone that cost about twelve and a half dollars. It looked like an easy thing to play with while I coughed and sneezed. I was fighting a summer cold, even though it is not summer elsewhere, it seems like it here. A nice [...]

02 April 2024 | St. Marys, GA
Sun Doggie
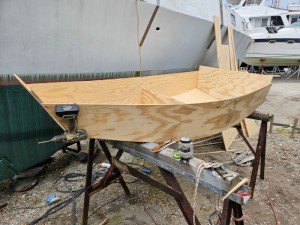
After laminating the cedar strips onto the gunwales of the dinghy I found the screws I used wouldn’t come out. The epoxy had seized them. The screw heads were stripped so I cut a straight slot in the heads with the cut off wheel. The cedar smoked when the screw heads got red hot. I could remove [...]
21 March 2024 | St. Marys, GA
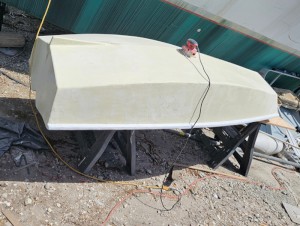
Just Add Water
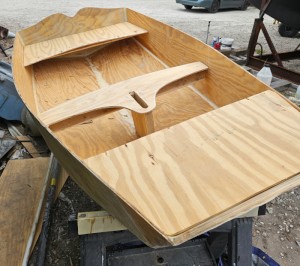
The rainy weekend started off with overcast and fog but no rain. It looked like I might be able to get something done on the D4 dinghy. I wanted to change the bow seat which is really the bow deck. The sailing option uses the deck to hold the freestanding mast. I didn’t like how the deck looked, [...]
01 March 2024 | St. Marys, GA
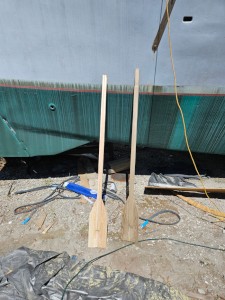
D4 Dinghy Alternative Seats
The rain event was more wind than rain, strong winds with gusts up to 44 mph. We drove into town to see what the harbor was like. There was a small sailboat that had dragged anchor and was sitting close to shore. The tide was out. We left and played with Bleu at Notter’s Pond.
23 February 2024 | St. Marys, GA
D4 Inside Seams
Day two of the dinghy build started out with me finishing wiring the hull bottoms together on the centerline of the bottom panels. This was much easier than the wiring of the chine edges of the bottom panels and the side panels.
Sir, Render
.
I found the shell scripts at:
.
https://opencpn.org/wiki/dokuwiki/doku.php?id=opencpn:supplementary_software:chart_conversion_manual:conversion_using_linux
.
In short, the shell scripts didn't work right out of the box. I thought I had help from a shell script guru, but he wasn't available when I began working on them. One script created folders for converted charts and activated a second script to tile the .pcx files together, tile together little pieces of a chart to make the full chart.
.
Unfortunately the script assumes a conversion process is successful, then removes the converted files. At first I thought nothing was happening and began tinkering with the scripts. A big mistake. I almost ended up deleting all the charts. Like a little kid with a machine gun. Shell scripts are very powerful computer routines that have to be handled with care.
.
I began to actually think instead of act on impulse. Computerese can be sticky, particular. I decided to try the stick-the-tiles-together-script right in the chart folder to see what happened. It was not easy to get it to run, but when it did I had some converted chart files there in front of me, and to my chagrin, watched the products of the conversion disappear right before my eyes. Have I ever seen a file melt away on a computer while I was watching it? But it was the shell script doing what it was programmed to do.
.
Part of the problem is that there are different versions of Linux around and also the applications come in different versions. Over the years things change and commands and parameters of a few years ago might not work on the updated apps of today. The shell scripts in question are from 2010, around when I retired, which seems long ago.
.
Once I realized that the shell script was actually working, I didn't want the temporary files to be removed, so I #'d out those commands, making them comments. Now if I ran the shell script in the chart's individual directory, the little tiles would be stitched together into a whole chart. And there it stood waiting for conversion to another format. I found that I could open the chart in Gimp, the Linux graphic manipulator, and work on it and then output it as a PNG file, which can be used to make a BSB chart.
.
I decided to find out why the first shell script wouldn't do its job of getting the second to do its job. I did this by reducing the number of chart files it had to work with. Then I parsed what was happening. All this work is done in Terminal mode where you enter commands like the old DOS shell. I read a tutorial on shell scripts to find out more. I found out you needed to somehow get the shell script to work from whatever directory you called it from, so I ended up putting the same shell script in my own BIN directory and the directory as indicated by the README file in the pcx2tif archive.
.
It didn't work that way, there was something wrong with the shell script. I parsed through it and wondered what could be the snag. It turned out to be a simple thing, I wondered why he put a $foo after the script in the line that called up the script. It didn't need an argument, so I deleted it.
.
Now the first shell script ran and asked the second shell script to do its thing. The computer ran and ran. There is a lot of extra code in those scripts to handle large matrices as well as small, so every time it ran a small matrix, it would output error codes on the items that weren't there.
.
I went to lunch.
.
When I came back the computer had finished the nested shell scripts. There was a lot of computer stuff I didn't include in this brief write up, and it was just an intuitive guess to allow the computer to run on its own while I went out. The main thing was that I thought it wouldn't hurt to let it run its course, I had noticed how hard the computer was running while processing these scripts, the fan was blowing hard and heat was coming out. I could see code running up the screen, followed by periods of seemingly inactivity, but I knew something was processing, there was too much heat coming out and the fan was running.
.
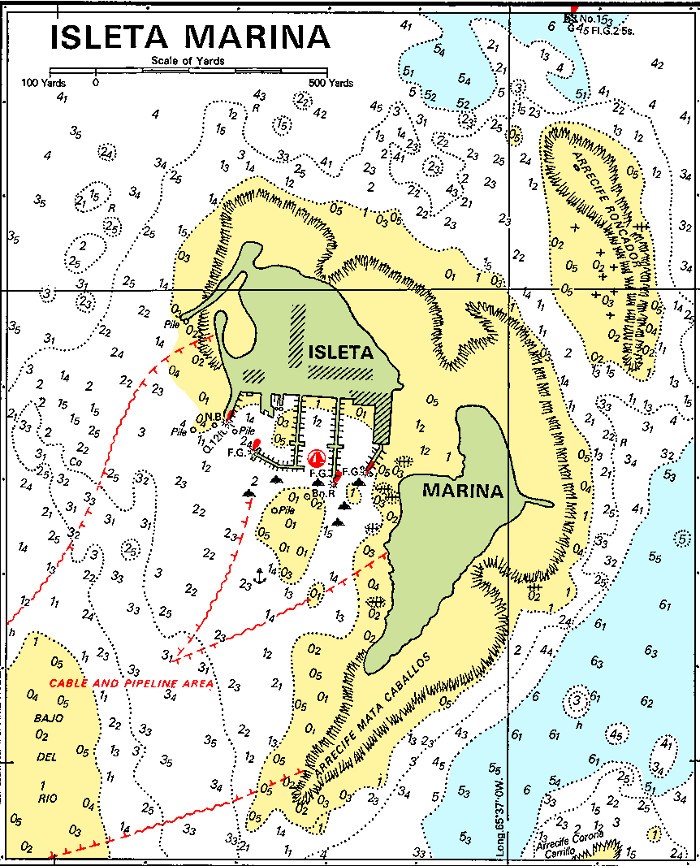
After the shell scripts ran there were new .pcx files in each chart folder. There were also two new files in the chart in .gif and .pcx form, called new1.gif and new1.pcx. Create a couple of folders labeled PNG and TIF in your chart directory. On your chart directory click NAME above the column of chart numbers. It will sort them. If the lowest numbered chart is at the top select it and continue, if not, click NAME again. It should now be sorted low numbers to high. Select the first chart by highlighting it, right click on its highlighted chart number and copy the number, right click and open it with Image Manipulator (Gimp). Select the view tab, select zoom, select fill window. The chart should blow up larger and over shoot the window. Select the Tools tab and select Selection Tools, select Rectangle Selection Tool. Now scroll the chart up until you can see the uppermost corners. Click on one corner and drag the rectangle box down to the opposite corner while holding the left mouse key down. Be precise to capture exactly what you want. The chart will ultimately appear on the navigation software and its edges will be exposed, so the less clutter there the better. After unclicking the chart should have its border highlighted. Select the Image tab, select Crop to Selection. The unwanted border will now be gone.
.
Now click on the File tab and select Export As. A dialog window will open up. The file name will be highlighted in a box at the top. In this case "new1.pcx", with "new1" highlighted. Put your cursor over it, right click and paste. The file number will now replace where "new1" was. Go to the bottom of the dialog and click on the Select File Type (by extension) entry and a box will open with lots of file types. Click on PNG which I found to be 3 pages down in the box. The file name at the top will now be the chart number.png. Now go to the Save in Folder line at the top of the dialog and select your PNG folder. Double click on it and it will open showing any PNG's that have been saved there. Now you can click Export, and another smaller dialog box will open, click Export in that one. A progress bar will march across the bottom of the dialog box as the chart is saved. After it is saved, do the same again, but this time for Select File Type (by extension) go down 5 pages and find the TIFF file extension. Then export it to the TIF folder just like you did with the PNG. X out the Image Manipulator window. It will ask Do you want to save.. Click on Discard Changes and then X out of the final Manipulator window.
.
You will be back where you started and can choose another chart to convert. After a while you will have a bunch of charts. They need to be indexed and calibrated to use on electronic navigation programs, but they can be printed as is, full size, and used as paper charts, or opened in Image Viewer for reference on the computer. There are helpful piloting instructions from the old days when sailors didn't blindly follow their GPS into port. It might be something like, line up the white house on the hill with the edge of the bluff and follow that line into port. Of course the white house on the hill may have been blown away by a hurricane 15 years ago, you have to update each chart with Notice to Mariners, get busy.